

MLBTR has been around for 15 years, and in that time the statistics we use to evaluate players have continually evolved. Today we’re going to discuss the pitching stats we’ll be using moving forward.
I’ve been contemplating moving away from K/9 and BB/9 to K% and BB% for a while now, a switch you might have noticed in my Top 50 Free Agents post. As many have noted in recent years, it just makes more sense to look at strikeouts as a percentage of batters faced rather than use innings as the denominator.
The problem with strikeouts per nine innings (K/9) is its interaction with the pitcher’s hits and walks allowed. Imagine a reliever who goes three innings, giving up six hits and six walks while also striking out three batters. Because of all the hits and walks, he faces 15 batters in total. His K/9 is 9.0. Every hit and walk extended the inning and gave him a fresh opportunity for a strikeout. His K% is 20% (three strikeouts out of 15 batters), which is subpar.
Imagine a different reliever who goes three innings, strikes out three, and retires the other six batters. His K/9 is 9.0. His K% is 33.3 (three strikeouts per nine batters), which is good.
K/9, BB/9, and K/BB served us well for a long time. They are by no means terrible, and most of us know the benchmarks better. But when something better comes along that isn’t difficult to understand and makes more intuitive sense to use, then it’s time to rip off the Band-Aid and start using it. That’s why we’ll be using K%, BB%, and K-BB% at MLBTR moving forward. To get a feel for the benchmarks, check out this handy chart, reprinted with permission from our friends at Baseball HQ.
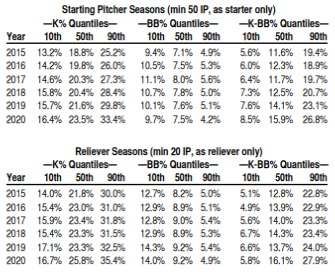
In 2020, the top-20 starting pitchers had a K% of at least 25, a BB% below about 7, and a K-BB% above about 18. Check out the starting pitcher leaderboard here. The top relievers strike out about 35% of batters faced, walk fewer than 5%, and have a K-BB% of at least 27. Play around with the reliever leaderboard here.
Notes on other pitching stats you’ll see at MLBTR:
- SIERA (Skill-Interactive ERA), developed by MLBTR contributor Matt Swartz, is my preference over FIP or xFIP. From what I’ve read, SIERA is the best at predicting future performance. Check out the 2020 SIERA leaderboard here.
- SwStr% (Swinging Strike Rate) is the ratio of swings and misses per pitches thrown. It can be used to help back up strikeout rate. Check out the leaderboard here.
- BABIP (Batting Average On Balls In Play)
- We’ll be using Statcast metrics at times, which are explained at the bottom of this page.
- I’m not a huge fan of WAR, especially in smaller samples, but it’s useful at times, widely recognized, and can be hard to ignore. It’s something I hope to unpack and reconsider when time allows.
- Don’t worry. We’re not going to abandon ERA.
Pitching stats you probably won’t see at MLBTR:
- K/9, BB/9, and K/BB for the aforementioned reasons.
- A pitcher’s win-loss record, with the possible exception of a salary arbitration discussion.
- WHIP, unless we’re writing about fantasy baseball.